Fenway Park Attendance and Ballpark Capacity
1912-2006
| Year |
Attendance |
Average |
2006
2005
2004
2003
2002
2001
2000
1999
1998
1997
1996
1995
1994
1993
1992
1991
1990
1989
1988
1987
1986
1985
1984
1983
1982
1981
1980
1979
1978
1977
1976
1975
1974
1973
1972
1971
1970
1969
1968
1967
1966
1965
1964
1963
1962
1961
1960
1959 |
2,930,588
2,847,888
2,837,294
2,724,165
2,650,862
2,625,333
2,585,895
2,446,162
2,314,704
2,226,136
2,315,231
2,164,410
1,775,818
2,422,021
2,468,574
2,562,435
2,528,986
2,510,012
2,464,851
2,231,551
2,147,641
1,786,633
1,661,618
1,782,285
1,950,124
1,060,379
1,956,092
2,353,114
2,320,643
2,074,549
1,895,846
1,748,587
1,556,411
1,481,002
1,441,718
1,678,732
1,595,278
1,833,246
1,940,788
1,727,832
811,172
652,201
883,276
942,642
733,080
850,589
1,129,866
984,102 |
36,180
35,159
35,028
33,632
32,727
32,412
31,925
30,200
28,577
27,483
28,583
30,061
27,747
29,901
30,476
31,635
31,222
30,988
30,430
27,894
26,514
22,057
20,514
22,004
24,076
20,007
24,149
29,414
28,301
25,932
23,406
21,587
19,215
18,284
18,484
20,984
19,695
22,633
23,960
21,331
10,014
8,052
10,905
11,783
9,279
10,373
14,674
12,781 |
|
|
| Year |
Attendance |
Average |
1958
1957
1956
1955
1954
1953
1952
1951
1950
1949
1948
1947
1946
1945
1944
1943
1942
1941
1940
1939
1938
1937
1936
1935
1934
1933
1932
1931
1930
1929
1928
1927
1926
1925
1924
1923
1922
1921
1920
1919
1918
1917
1916
1915
1914
1913
1912 |
1,077,047
1,181,087
1,137,158
1,203,200
931,127
1,026,133
1,115,750
1,312,282
1,344,080
1,596,650
1,558,798
1,427,315
1,416,944
603,794
506,975
358,275
730,340
718,497
716,234
573,070
646,459
559,659
626,895
558,568
610,640
268,715
182,150
350,975
444,045
394,620
396,920
305,275
285,155
267,782
448,556
229,688
259,184
279,273
402,445
417,291
249,513
387,856
496,397
539,885
481,359
437,194
597,096 |
13,988
15,339
14,579
15,426
11,786
13,502
14,490
17,497
17,456
20,736
19,985
17,621
18,166
7,741
6,500
4,653
9,485
9,331
9,066
7,641
8,619
7,563
8,141
7,070
7,930
3,732
2,366
4,387
5,843
5,059
5,364
3,914
3,703
3,570
5,825
2,945
3,550
3,627
5,295
6,323
3,564
4,848
6,364
7,104
6,093
5,829
7,655 |
|
Years the Red Sox have led the league in attendance:
1914, 1915, 1967, 1969, 1970, 1971, 1974, 1975
Official Fenway Park capacity:
1912-1946: 35,000
1947-1948: 35,500
1949-1952: 35,200
1953-1957: 34,824
1958-1959: 34,819
1960: 33,368
1961-1964: 33,357
1965-1967: 33,524
1968-1970: 33,375
1971-1975: 33,379
1976: 33,437
1977-1978: 33,513
|
1979-1980: 33,538
1981-1982: 33,536
1983-1984: 33,465
1985-1988: 33,583
1989-1990: 34,182
1991: 34,171
1992: 33,925
1993-2000: 34,218
2001-2002: 33,577 (day), 33,993 (night)
2003: 34,482 (day), 34,898 (night)
2004-2005: 34,679 (day), 35,095 (night)
2006: 35,692 (day), 36,108 (night)
|
Ballpark capacity notes:
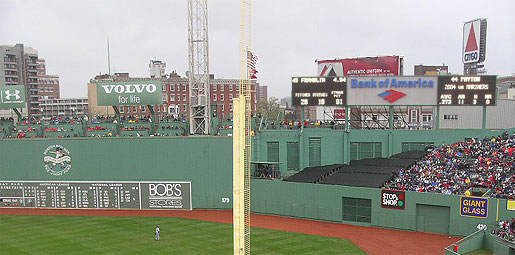
For day games, 416 seats in the center field bleachers are covered with a tarp so hitter's have a better background to see the ball.
Reported attendance for individual games is sometimes listed below capacity due to the distribution of complimentary and promotional tickets.
The Red Sox have announced that capacity could be increased to as much as 39,968 by 2012, the 100th year anniversary of Fenway Park.
Boston's Pastime is not affiliated with the Boston Red Sox or Major League Baseball.
|